Key Performance Indicators Examples to Boost Business Growth
Discover key performance indicators examples to enhance your strategies. Learn how KPIs can drive decision-making and improve results effectively.
Understanding the Power of KPIs
Key performance indicators (KPIs) provide the crucial data-driven insights needed to steer your business toward its objectives. This listicle dives into seven key performance indicators examples, offering a strategic analysis of each to help you select and implement the right KPIs for your organization. You'll learn how to use these metrics to track progress, pinpoint areas for improvement, and ultimately make more effective decisions.
This in-depth exploration goes beyond surface-level descriptions. We’ll uncover the strategic "why" behind each KPI, providing actionable takeaways and replicable strategies. Whether you're a Business Owner, CEO, CTO, Operations Lead, or AI Strategist in the NL region, this comprehensive guide will empower you to leverage KPIs for maximum impact.
Here's what we'll cover:
-
Net Promoter Score (NPS): Gauging customer loyalty and identifying growth opportunities.
-
Customer Acquisition Cost (CAC): Optimizing marketing spend and improving ROI.
-
Employee Net Promoter Score (eNPS): Measuring employee satisfaction and its impact on productivity.
-
Monthly Recurring Revenue (MRR): Tracking predictable revenue streams and forecasting future growth.
-
Conversion Rate: Analyzing the effectiveness of your sales and marketing funnels.
-
Return on Investment (ROI): Evaluating the profitability of your investments.
-
Churn Rate: Identifying customer retention issues and developing effective strategies.
By understanding these key performance indicators examples and their practical applications, you can gain a competitive edge in the market and drive sustainable growth. Let's dive in.
1. Net Promoter Score (NPS)
Net Promoter Score (NPS) is a key performance indicator (KPI) that gauges customer loyalty and satisfaction. It's a simple yet powerful metric that predicts business growth by measuring the likelihood of customers recommending a company's product or service. The survey asks customers, "On a scale of 0 to 10, how likely are you to recommend [company/product/service] to a friend or colleague?"
How NPS Works
Responses are categorized into three groups:
-
Promoters (9-10): Loyal enthusiasts who actively champion your brand.
-
Passives (7-8): Satisfied customers who are susceptible to competitive offerings.
-
Detractors (0-6): Unhappy customers who can damage your brand through negative word-of-mouth.
NPS is calculated by subtracting the percentage of detractors from the percentage of promoters, resulting in a score between -100 and +100. A higher score indicates a greater likelihood of customer loyalty, positive word-of-mouth referrals, and ultimately, business growth.
Successful Implementations of NPS
Companies like Apple, Tesla, Amazon Prime, and Southwest Airlines leverage NPS to understand customer sentiment and drive improvements. Apple consistently maintains scores above 70, showcasing its strong customer loyalty. Tesla achieved an impressive NPS of 96 in 2020, the highest in the automotive industry, demonstrating the power of a compelling product and brand experience. Southwest Airlines uses NPS to maintain its leadership in customer loyalty within the competitive airline industry. Amazon Prime, with scores typically above 60, uses NPS to continually refine its offerings and maintain its massive subscriber base.
Actionable Tips for Using NPS
-
Follow Up: After the initial NPS survey, include open-ended questions to gain deeper insights into customer feedback. Understanding the "why" behind the score is crucial for actionable improvements.
-
Segmentation: Segment NPS results by customer demographics, product lines, or other relevant factors. This allows for targeted interventions and personalized experiences.
-
Automation: Set up automated NPS surveys at key touchpoints in the customer journey, such as after a purchase or customer service interaction. This provides continuous feedback and allows for timely responses to issues.
-
Benchmarking: Benchmark your NPS against industry averages to gain a broader perspective on your performance. The infographic below illustrates typical NPS benchmarks across different industries. Don't solely rely on internal targets.
-
Action & Communication: Act on the feedback received and communicate changes back to customers. Closing the feedback loop demonstrates a commitment to customer satisfaction and builds trust.
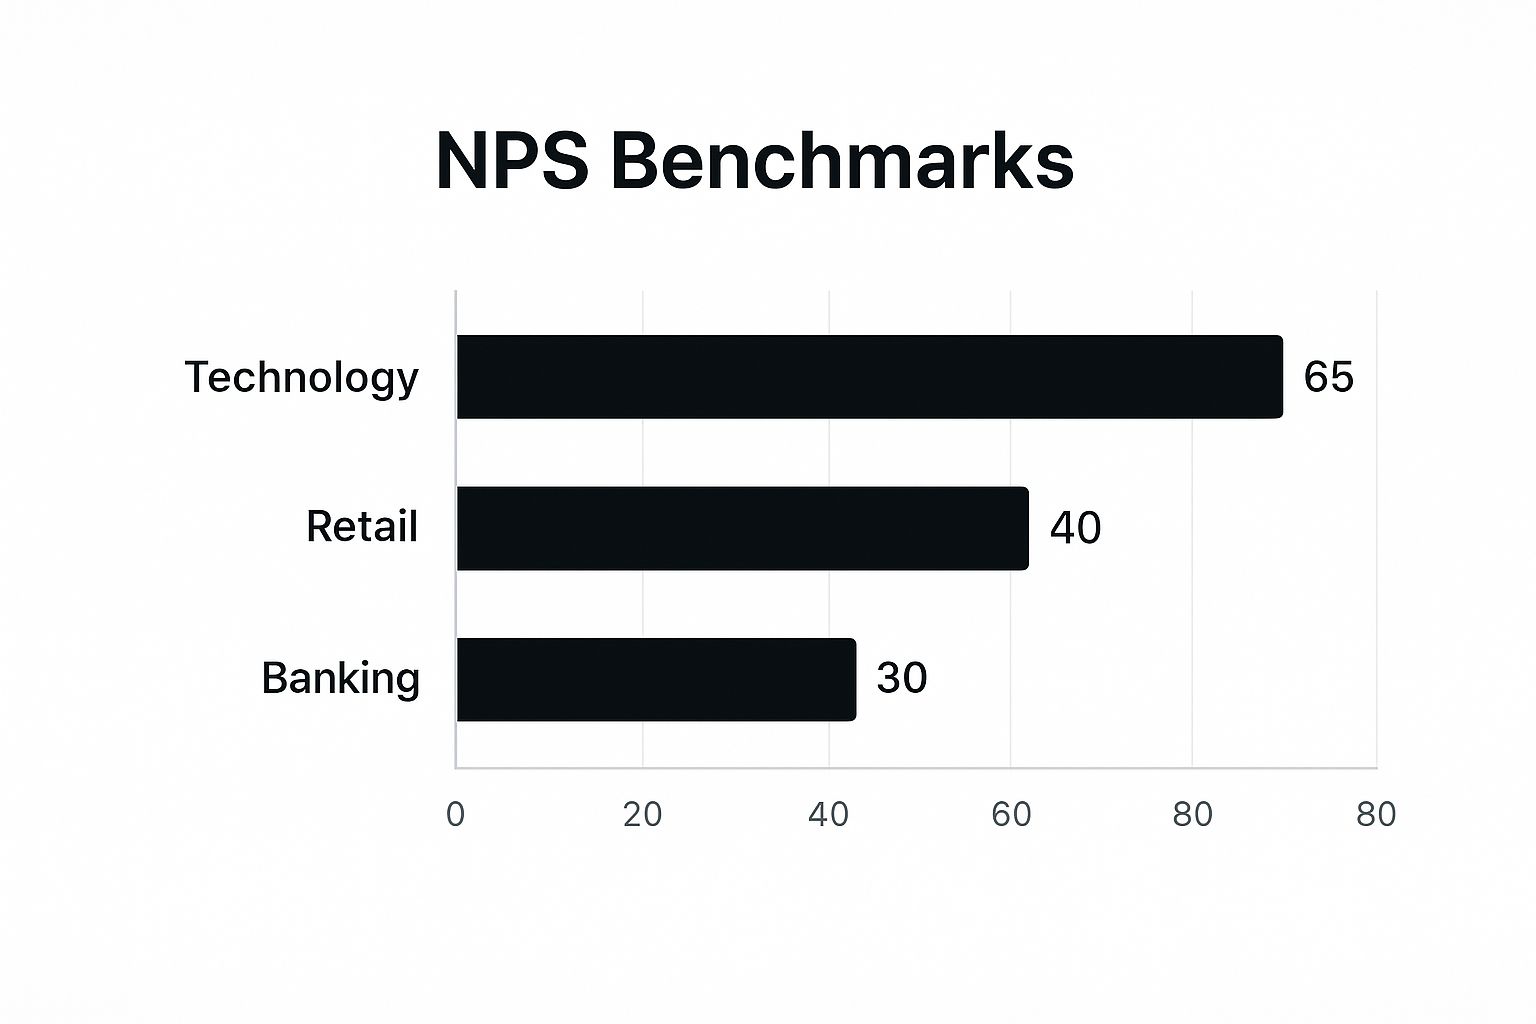
The horizontal bar chart above, titled 'NPS Benchmarks,' displays average Net Promoter Scores across three industries. As the chart visualizes, Technology companies enjoy the highest average NPS at 65, followed by Retail at 40, and Banking at 30.
When and Why to Use NPS
NPS provides a valuable, high-level overview of customer loyalty and satisfaction. It's particularly useful for:
-
Tracking customer sentiment over time
-
Identifying areas for improvement in products and services
-
Measuring the impact of customer experience initiatives
-
Predicting customer churn and future revenue
NPS deserves a prominent place in any KPI toolkit because it offers a concise, quantifiable measure of customer loyalty that is easy to understand and track. By actively monitoring and acting upon NPS feedback, businesses can improve customer retention, boost referrals, and drive sustainable growth. It's a powerful tool for building a customer-centric culture and fostering long-term success.
2. Customer Acquisition Cost (CAC)
Customer Acquisition Cost (CAC) is a key performance indicator (KPI) that measures the total cost of acquiring a new customer. It encompasses all marketing and sales expenses, divided by the number of new customers acquired within a specific period. This metric is crucial for understanding the efficiency of marketing investments and the effectiveness of pricing strategies. It helps businesses determine the profitability of their customer acquisition efforts and optimize their spending for maximum return.

How CAC Works
Calculating CAC involves summing all marketing and sales costs incurred during a specific period, including advertising spend, content creation, salaries, commissions, and software costs. This total is then divided by the number of new customers acquired during the same period. A lower CAC indicates higher efficiency in acquiring customers.
Successful Implementations of CAC
Several companies have demonstrated successful CAC management. HubSpot, for example, reduced its CAC by 70% through inbound marketing strategies, focusing on attracting customers organically through valuable content and SEO. Dropbox achieved remarkably low CAC through a viral referral program, incentivizing existing users to bring in new customers. Uber's CAC varies significantly by city, ranging from $15 to $400 per rider, reflecting the different market dynamics and competitive landscapes. Netflix maintains a CAC around $90-$300 depending on the region, highlighting the influence of subscriber acquisition costs in the streaming industry.
Actionable Tips for Using CAC
-
Channel-Specific Calculation: Calculate CAC by specific channels (e.g., social media, paid search, email) to identify the most efficient sources and allocate budget accordingly.
-
Include All Costs: Include often-overlooked costs like sales team salaries, CRM software, and content creation tools in your CAC calculations for a complete picture.
-
Track Trends: Track CAC trends over 6-12 month periods to avoid seasonal distortions and gain insights into long-term performance.
-
Maintain CAC:CLV Ratio: Strive for a CAC:Customer Lifetime Value (CLV) ratio of at least 1:3 for healthy unit economics, ensuring that the value generated by customers significantly outweighs the cost of acquiring them.
-
Regularly Audit Attribution: Regularly audit your attribution models to ensure accurate CAC calculation and identify the true impact of different marketing touchpoints.
When and Why to Use CAC
CAC provides essential insights into the financial viability of customer acquisition efforts. It's particularly useful for:
-
Evaluating Marketing ROI: Assessing the effectiveness of different marketing campaigns and channels.
-
Optimizing Spending: Identifying areas where marketing budgets can be reallocated for better results.
-
Pricing Strategy: Informing pricing decisions to ensure profitability and sustainable growth.
-
Forecasting Growth: Projecting future customer acquisition costs and their impact on overall business performance.
Why CAC Deserves a Place in Your KPI Toolkit
CAC is an indispensable KPI for any business focused on growth and profitability. It provides a quantifiable measure of the efficiency of customer acquisition, allowing businesses to make data-driven decisions about their marketing and sales strategies. By actively monitoring and optimizing CAC, businesses can improve their bottom line, maximize ROI, and achieve sustainable growth. It's a key metric for understanding the true cost of acquiring customers and making informed decisions about resource allocation. Tracking CAC is particularly crucial in competitive markets and rapidly scaling businesses. Ignoring this key metric can lead to unsustainable spending and hinder long-term profitability.
3. Employee Net Promoter Score (eNPS)
Employee Net Promoter Score (eNPS) adapts the traditional NPS framework to measure employee engagement and satisfaction. It gauges internal loyalty by asking employees how likely they are to recommend their workplace to friends or colleagues. This simple yet powerful metric provides a valuable snapshot of employee sentiment and can predict future employee turnover. It's calculated using the same methodology as customer NPS but focuses on internal stakeholder satisfaction, offering crucial insights into the health of your organization.
How eNPS Works
The core of eNPS lies in a single question: "On a scale of 0 to 10, how likely are you to recommend [company name] as a place to work?"
Based on their responses, employees are segmented into three categories:
-
Promoters (9-10): Engaged and enthusiastic employees who are likely to speak positively about the company. They are your brand ambassadors within their networks.
-
Passives (7-8): Generally satisfied but not necessarily passionate employees. They are susceptible to attractive offers from competitors.
-
Detractors (0-6): Dissatisfied employees who are likely to share negative experiences and potentially damage the company's reputation.
eNPS is calculated by subtracting the percentage of detractors from the percentage of promoters. The result is a score between -100 and +100. Higher scores indicate a more engaged and satisfied workforce.
Successful Implementations of eNPS
Several leading companies effectively utilize eNPS to drive positive change within their organizations. Google, known for its strong culture, maintains an eNPS above 40 through comprehensive initiatives focused on employee well-being and development. Salesforce incorporates eNPS as a key metric in executive compensation, directly linking leadership performance to employee satisfaction. Netflix correlates a high eNPS (50+) with low turnover rates, demonstrating the link between engagement and retention. Microsoft significantly improved its eNPS from -5 to +25 under Satya Nadella's leadership by focusing on a culture of growth and innovation.
Actionable Tips for Using eNPS
-
Follow-Up Questions: Include open-ended follow-up questions after the eNPS survey to gather qualitative insights. Understanding the "why" behind the score is critical for implementing meaningful improvements.
-
Benchmarking: Compare your eNPS against industry averages to gain context and identify areas where you excel or need to improve. Don't solely rely on internal trends.
-
Anonymity: Guarantee complete anonymity to encourage honest feedback. Employees are more likely to share their true opinions if they feel their responses are confidential.
-
Action and Communication: Act on the feedback received and communicate changes back to employees. This demonstrates that their voices are heard and valued.
-
Segmentation: Analyze eNPS results by department, manager, tenure, or other relevant factors. This allows for targeted interventions and personalized solutions.
When and Why to Use eNPS
eNPS provides a valuable high-level overview of employee engagement and satisfaction. It's particularly useful for:
-
Tracking employee sentiment over time.
-
Identifying areas for improvement in company culture and employee experience.
-
Measuring the impact of HR initiatives and leadership changes.
-
Predicting employee turnover and identifying potential retention risks.
eNPS deserves a prominent place in any key performance indicators examples list as it offers a concise, quantifiable measure of employee loyalty that's easy to understand and track. By actively monitoring and acting upon eNPS feedback, businesses can improve employee retention, boost morale, and create a more productive and positive work environment. It's a powerful tool for building a thriving organizational culture and achieving long-term success.
4. Monthly Recurring Revenue (MRR)
Monthly Recurring Revenue (MRR) is a key performance indicator (KPI) that measures the predictable revenue generated from subscription customers each month. MRR is fundamental for SaaS and subscription businesses, providing crucial insight into business growth, customer retention, and revenue predictability. It's calculated by summing all monthly subscription fees from active customers. This provides a clear picture of the reliable income stream.
How MRR Works
Calculating MRR involves adding up all recurring subscription revenue normalized to a monthly period. This means annual subscriptions are divided by 12, quarterly subscriptions by three, and so on. This standardization allows for accurate month-over-month comparisons and trend analysis. It's important to exclude one-time fees or non-recurring charges to maintain the integrity of the metric.
Successful Implementations of MRR
Zoom exemplifies the power of MRR growth. Between 2019 and 2021, Zoom's MRR skyrocketed from $60 million to $623 million, demonstrating the impact of meeting market demand. Slack, achieving a $400 million Annual Recurring Revenue (ARR), which translates to approximately $33 million MRR, showcased its value proposition before its acquisition by Microsoft. HubSpot, maintaining over 30% year-over-year MRR growth, demonstrates the potential for sustainable expansion in the SaaS market. Shopify leverages its subscription MRR as a stable foundation for its total revenue, highlighting the importance of recurring revenue streams.
Actionable Tips for Using MRR
-
Component Breakdown: Separate MRR into its core components: new MRR, expansion MRR (from upgrades or upsells), contraction MRR (from downgrades), and churned MRR (lost customers). This granular view provides deeper insights into revenue drivers.
-
Cohort Analysis: Track MRR cohorts (groups of customers who started their subscriptions in the same month) to understand customer behavior patterns and identify potential churn risks.
-
Seasonality Adjustments: Normalize MRR for seasonal variations if your subscription business experiences predictable fluctuations throughout the year. This provides a clearer picture of underlying growth trends.
-
Per-Customer Metrics: Monitor MRR per customer and average contract values to understand customer lifetime value and identify opportunities for expansion.
-
Foundation for Other Metrics: Use MRR as the foundation for calculating other crucial SaaS metrics like Customer Lifetime Value (LTV) and Customer Acquisition Cost (CAC).
When and Why to Use MRR
MRR provides a vital, real-time snapshot of the financial health of subscription-based businesses. It's particularly useful for:
-
Growth Tracking: Monitoring revenue growth and identifying trends.
-
Performance Evaluation: Assessing the effectiveness of sales and marketing efforts.
-
Forecasting: Predicting future revenue and making informed business decisions.
-
Investor Communication: Communicating business performance to investors and stakeholders.
-
Valuation: Playing a key role in determining the valuation of SaaS businesses.
MRR deserves a prominent place in any SaaS KPI toolkit because it offers a precise, quantifiable measure of predictable revenue. By actively monitoring and analyzing MRR, businesses can gain actionable insights into customer behavior, optimize pricing strategies, and drive sustainable growth. It’s an indispensable tool for understanding the financial health and future potential of any subscription-based business.
5. Conversion Rate
Conversion Rate is a key performance indicator (KPI) that measures the percentage of visitors or prospects who complete a desired action. This action could be making a purchase, signing up for a newsletter, downloading content, or requesting a quote. It's a crucial metric for evaluating the effectiveness of marketing campaigns, website usability, and overall user experience. It is calculated by dividing the number of conversions by the total number of visitors and multiplying by 100.
How Conversion Rate Works
Conversion Rate provides a quantifiable measure of how well your website or marketing efforts are turning visitors into customers or leads. A higher conversion rate signifies that your strategies are effectively engaging users and prompting them to take the desired action. Conversely, a low conversion rate suggests areas for improvement in user experience, messaging, or targeting.
The formula is straightforward: (Number of Conversions / Total Number of Visitors) * 100 = Conversion Rate. For instance, if your website had 10,000 visitors and 200 of them made a purchase, your conversion rate would be 2%.
Successful Implementations of Conversion Rate
Several companies have demonstrated the power of optimizing conversion rates. Amazon boasts a conversion rate of approximately 13%, significantly higher than the average e-commerce rate, highlighting their mastery of personalized recommendations and streamlined checkout process. Email marketing platforms like Mailchimp achieve impressive email-to-website conversion rates of over 20% by leveraging targeted campaigns and compelling calls to action. Even seemingly small improvements can have a large impact. Unbounce, a landing page platform, found that the average landing page conversion rate is around 4.02%, proving the effectiveness of dedicated landing pages for specific campaigns.
Actionable Tips for Using Conversion Rate
-
A/B Testing: Experiment with different page elements, such as headlines, calls to action, and images, to identify what resonates best with your audience and drives higher conversions.
-
Traffic Source Analysis: Track conversion rates by traffic source (e.g., organic search, paid advertising, social media) to understand which channels are most effective and optimize your channel mix accordingly.
-
Mobile vs. Desktop: Monitor conversion rates separately for mobile and desktop users. This helps tailor user experiences for each platform and address any device-specific issues impacting conversions.
-
Goal Funnels: Implement goal funnels in analytics platforms to visualize the steps users take towards conversion and identify drop-off points. This pinpoints areas of friction in the user journey.
-
Micro-Conversions: Track smaller actions that contribute to the overall conversion goal, such as adding items to a cart or signing up for a free trial. These "micro-conversions" provide valuable insights into user engagement.
When and Why to Use Conversion Rate
Conversion Rate is a fundamental KPI for any business with an online presence. It's particularly useful for:
-
Measuring Marketing Effectiveness: Evaluating the success of marketing campaigns and identifying areas for optimization.
-
Improving User Experience: Identifying pain points in the customer journey and streamlining the path to conversion.
-
Increasing Sales and Revenue: Directly impacting the bottom line by driving more conversions and maximizing the return on marketing investments.
-
Optimizing Website Performance: Identifying areas for improvement in website design, content, and functionality.
Conversion Rate is a key performance indicator that should be central to any digital strategy. By actively monitoring, analyzing, and optimizing this metric, businesses can improve user experience, boost sales, and drive sustainable growth. It provides a clear, actionable metric for measuring success and making data-driven decisions. This KPI provides insights into how effectively you’re turning potential customers into paying customers or engaged leads.
6. Return on Investment (ROI)
Return on Investment (ROI) is a fundamental key performance indicator (KPI) that measures the efficiency of an investment. It calculates the ratio of net profit to the cost of investment, expressed as a percentage. ROI helps evaluate the profitability of various investments, from marketing campaigns to large-scale business initiatives. It provides a clear picture of how effectively resources are being utilized to generate returns.
How ROI Works
The core formula for calculating ROI is: (Gain from Investment - Cost of Investment) / Cost of Investment × 100. This formula provides a percentage that reflects the return generated for every dollar invested. A positive ROI indicates profitability, while a negative ROI signifies a loss.
Successful Implementations of ROI
Numerous companies leverage ROI to assess the effectiveness of their investments. Coca-Cola's 'Share a Coke' campaign, which personalized Coke bottles with common names, achieved a reported 600% ROI. This success illustrates the power of targeted marketing and emotional connection with consumers. IBM, focusing on AI and automation investments, reports an average 300% ROI, highlighting the potential of technology to drive significant business value. Email marketing, a consistently strong performer, typically generates $42 ROI for every $1 spent, demonstrating its cost-effectiveness. Google Ads, a staple in digital marketing, boasts an average ROI of 200% across all industries, showcasing its reach and targeting capabilities.
Actionable Tips for Using ROI
-
Include All Costs: Factor in all relevant costs, not just the direct marketing spend. This includes labor, overhead, and other indirect expenses for a complete picture of the investment.
-
Track Over Time: Monitor ROI over multiple time periods to understand the full impact of an investment. Short-term results may differ from long-term gains.
-
Cross-Channel Comparison: Compare ROI across different channels and campaigns to identify the most effective strategies. This data-driven approach optimizes resource allocation.
-
Use Alongside Other Metrics: Consider using ROI in conjunction with other metrics like payback period to gain a comprehensive understanding of investment performance.
-
Consider ROAS: For marketing-specific calculations, use Return on Ad Spend (ROAS) which focuses solely on advertising expenditures.
When and Why to Use ROI
ROI is a versatile metric applicable across diverse business functions. It is particularly useful for:
-
Evaluating Investment Performance: Assessing the profitability of different projects or initiatives.
-
Making Informed Decisions: Guiding resource allocation and strategic planning.
-
Measuring Marketing Effectiveness: Determining the success of marketing campaigns and channels.
-
Benchmarking Performance: Comparing the efficiency of internal operations against industry benchmarks.
ROI's Place in the KPI Toolkit
ROI deserves a prominent place in any KPI toolkit due to its fundamental role in evaluating investment efficiency. It provides a clear, quantifiable measure of profitability, enabling businesses to make informed decisions about resource allocation, strategy development, and operational improvements. By actively monitoring and acting upon ROI data, businesses can optimize their investments and drive sustainable growth. It is a cornerstone for achieving financial success and maximizing returns.
7. Churn Rate
Churn rate is a key performance indicator (KPI) that measures the percentage of customers who stop using a product or service during a specific time period. Also known as attrition rate, it's a critical metric for understanding customer retention and the overall health of a business, especially for subscription-based models. Calculating churn involves dividing the number of customers lost during a period by the total number of customers at the beginning of that period.

How Churn Rate Works
Churn rate provides insights into customer satisfaction, product-market fit, and the effectiveness of customer retention strategies. A high churn rate signals potential problems with the product, pricing, customer service, or overall customer experience. Conversely, a low churn rate suggests strong customer loyalty and a sustainable business model.
Successful Implementations of Churn Rate
Netflix, a leading streaming platform, maintains an annual churn rate below 5% in mature markets, demonstrating its ability to retain subscribers through compelling content and a seamless user experience. Spotify, a popular music streaming service, also boasts a relatively low monthly churn rate of approximately 5% for premium subscribers, highlighting the value proposition of its ad-free music library and personalized recommendations. Within the SaaS industry, companies typically target monthly churn rates below 5%, recognizing the importance of minimizing customer attrition for recurring revenue streams. Conversely, industries like telecommunications often experience higher annual churn rates, averaging between 15-25%, due to factors like increased competition and contract expirations.
Actionable Tips for Using Churn Rate
-
Dual Calculation: Calculate both customer churn and revenue churn separately. Customer churn tracks the number of lost customers, while revenue churn measures the lost recurring revenue from those customers. This provides a comprehensive view of churn's impact.
-
Early Warning Systems: Implement early warning systems based on usage patterns. Identify at-risk customers early on through decreased activity or engagement, enabling proactive intervention and retention efforts.
-
Segmented Analysis: Segment churn analysis by customer acquisition channel. This allows for targeted interventions and personalized experiences, helping identify weak points in specific acquisition strategies.
-
Cohort Analysis: Track cohort-based churn to understand customer lifecycle patterns. Analyzing churn rates by customer cohorts (e.g., customers acquired in the same month) reveals trends and identifies specific periods where churn is highest.
-
Focus on Early Churn: Focus on reducing churn in the first 90 days when rates are typically highest. Onboarding processes and early customer support play crucial roles in initial customer retention.
When and Why to Use Churn Rate
Churn rate is a fundamental KPI for any business focused on customer retention, particularly those with subscription models. It's useful for:
-
Monitoring Customer Health: Tracking customer satisfaction and loyalty over time, providing insights into product-market fit.
-
Predicting Revenue: Forecasting future revenue based on retention rates and identifying potential revenue leakage.
-
Optimizing Customer Acquisition Cost (CAC): Balancing customer acquisition costs with customer lifetime value (CLTV) for profitable growth.
-
Improving Customer Experience: Identifying pain points in the customer journey and driving improvements in product, service, and overall experience.
Churn rate deserves a crucial place in any KPI toolkit. It's a direct indicator of customer satisfaction and business health, enabling proactive intervention to improve retention, protect revenue, and drive sustainable growth. By actively monitoring and addressing churn, businesses can build a loyal customer base and maximize long-term success.
Key Metrics Comparison of 7 KPIs
|
Metric |
Implementation Complexity |
Resource Requirements |
Expected Outcomes |
Ideal Use Cases |
Key Advantages |
|---|---|---|---|---|---|
|
Net Promoter Score (NPS) |
Low - single-question survey |
Minimal - simple survey tool |
Measures customer loyalty and satisfaction |
Customer experience and retention |
Easy to implement; industry benchmarks; actionable |
|
Customer Acquisition Cost (CAC) |
Medium - requires detailed cost tracking |
Moderate - marketing and sales data needed |
Measures cost efficiency of acquiring customers |
Marketing ROI; budgeting |
Helps optimize spend; essential for unit economics |
|
Employee Net Promoter Score (eNPS) |
Low - single-question survey |
Minimal - anonymous employee surveys |
Measures employee engagement and satisfaction |
HR and employee retention |
Quick feedback; correlates with retention and productivity |
|
Monthly Recurring Revenue (MRR) |
Medium - revenue data aggregation |
Moderate - subscription billing systems |
Measures predictable subscription revenue |
SaaS and subscription businesses |
Predictable revenue; aids forecasting and valuation |
|
Conversion Rate |
Low to Medium - traffic and event tracking |
Moderate - web analytics tools |
Measures percentage of visitors completing actions |
Marketing and UX optimization |
Direct marketing effectiveness measurement |
|
Return on Investment (ROI) |
Medium - requires accurate cost/return data |
Varies - depends on data availability |
Measures profitability and efficiency of investments |
Financial analysis and budgeting |
Universal metric; simple and widely understood |
|
Churn Rate |
Medium - customer activity tracking |
Moderate - CRM and billing data |
Measures customer loss over time |
Subscription and retention focus |
Direct customer satisfaction indicator; predictive |
Turning Insights into Action
This comprehensive exploration of key performance indicators examples has provided a practical framework for understanding and utilizing vital metrics across various business functions. From customer satisfaction measured by Net Promoter Score (NPS) to financial performance indicated by Monthly Recurring Revenue (MRR) and Return on Investment (ROI), we’ve delved into the core KPIs that drive business success. We've also examined critical metrics like Customer Acquisition Cost (CAC), Churn Rate, and Conversion Rate, providing insights into optimizing resource allocation and customer lifecycle management. Furthermore, understanding Employee Net Promoter Score (eNPS) empowers you to gauge employee satisfaction and its impact on overall performance.
Connecting KPIs to Strategic Objectives
The true value of these key performance indicators examples lies not just in their individual measurements, but in their interconnectedness and alignment with your overall strategic objectives. By analyzing these KPIs in concert, you can gain a holistic view of your business performance and identify areas for improvement. For instance, a high CAC coupled with a low Conversion Rate signals a need to refine your marketing and sales funnels. Similarly, a declining NPS, alongside a rising Churn Rate, may indicate underlying issues with customer experience requiring immediate attention.
Actionable Takeaways for Implementing KPIs
Implementing these key performance indicators examples requires a strategic approach. Begin by prioritizing the KPIs most relevant to your specific business goals. Establish clear benchmarks and targets for each KPI. Regularly track and analyze the data, looking for trends and patterns. Crucially, translate these insights into actionable steps, whether that’s refining marketing campaigns, improving product features, or enhancing customer service protocols.
Here’s a quick recap of actionable steps:
-
Prioritize relevant KPIs: Don't track everything at once. Start with the metrics most critical to your current business objectives.
-
Set clear benchmarks: Define realistic yet ambitious targets for each chosen KPI to measure progress effectively.
-
Regularly track and analyze: Consistent monitoring and analysis are key to identifying trends and potential issues.
-
Translate insights into action: Use the data to inform strategic decisions and operational adjustments for continuous improvement.
The Power of Data-Driven Decision Making
Mastering the use of key performance indicators examples empowers you to transition from reactive to proactive decision-making. Data-driven insights replace guesswork, enabling you to optimize resource allocation, improve operational efficiency, and drive sustainable growth. By focusing on the "why" behind the numbers, you can unlock the full potential of these KPIs and transform your business performance. This is particularly important in the dynamic NL business landscape, where adaptability and data-driven strategies are essential for success.
From Insight to Transformation
Remember, the journey doesn't end with understanding key performance indicators examples. The true power lies in turning insights into action. By embedding a data-driven culture within your organization, you create a feedback loop of continuous improvement, innovation, and growth. This empowers you to not just react to market changes, but to anticipate them and proactively shape your future.
Leverage the power of AI to transform your KPI data into actionable strategies. Ekipa AI provides tailored AI solutions that help you uncover hidden opportunities and drive transformative change within your organization. Visit Ekipa AI to learn more about how we can help you unlock the full potential of your key performance indicators.


